Cold Chain Seafood Monitoring Devices in 2025?
Cold chain seafood monitoring devices help you catch temperature spikes, long warm holds, and “invisible delays” that quietly destroy shelf life. In 2025, you win by choosing the right device for the decision speed you actually have. If your team can act mid-route, you need alerts. If you can only act after delivery, you need reliable records and a weekly review loop.
This article will answer for you:
- How real-time temperature monitoring for seafood shipments prevents silent spoilage
- What to choose: data loggers vs real-time monitors vs TTIs (and why)
- How a GPS temperature tracker for seafood logistics reduces disputes and delay confusion
- The best placement for temperature loggers in seafood boxes so the data reflects product risk
- How to build SOPs so cold chain seafood monitoring devices create action, not noise
Cold chain seafood monitoring devices: What problem do they solve?
Cold chain seafood monitoring devices solve one core problem: you cannot fix what you cannot see. Seafood can arrive “looking fine” yet lose shelf life after repeated short warm events at docks, hubs, and last-mile stops. Devices turn those hidden moments into measurable evidence, so you stop guessing and start improving.
Packaging slows warming, but it cannot tell you what happened during a specific delay. Monitoring fills that gap. A simple way to explain it to your team: packaging is the seatbelt, monitoring is the dashboard warning light.
The 3 signals you should capture first
Start simple. If you track these three signals well, you will find most root causes fast.
| Signal | What it tells you | Devices that capture it | Practical meaning for you |
|---|---|---|---|
| Peak temperature | “Did it ever get too warm?” | Logger, tracker | Predicts rejects and odor issues |
| Time above limit | “How long was it risky?” | Logger, tracker | Predicts shelf-life loss |
| Where it happened | “Dock, hub, or last mile?” | Real-time + GPS | Pinpoints the process fix |
Practical tips you can use today
- If claims feel random: measure staging time and door-open spikes first.
- If data is messy: standardize one device type and one SOP before scaling.
- If alerts get ignored: reduce alerts to “only what needs action now.”
Practical case: A seafood hub reduced complaints after finding a repeat warm spike during peak-hour staging—visible only after monitoring at the dock handoff.
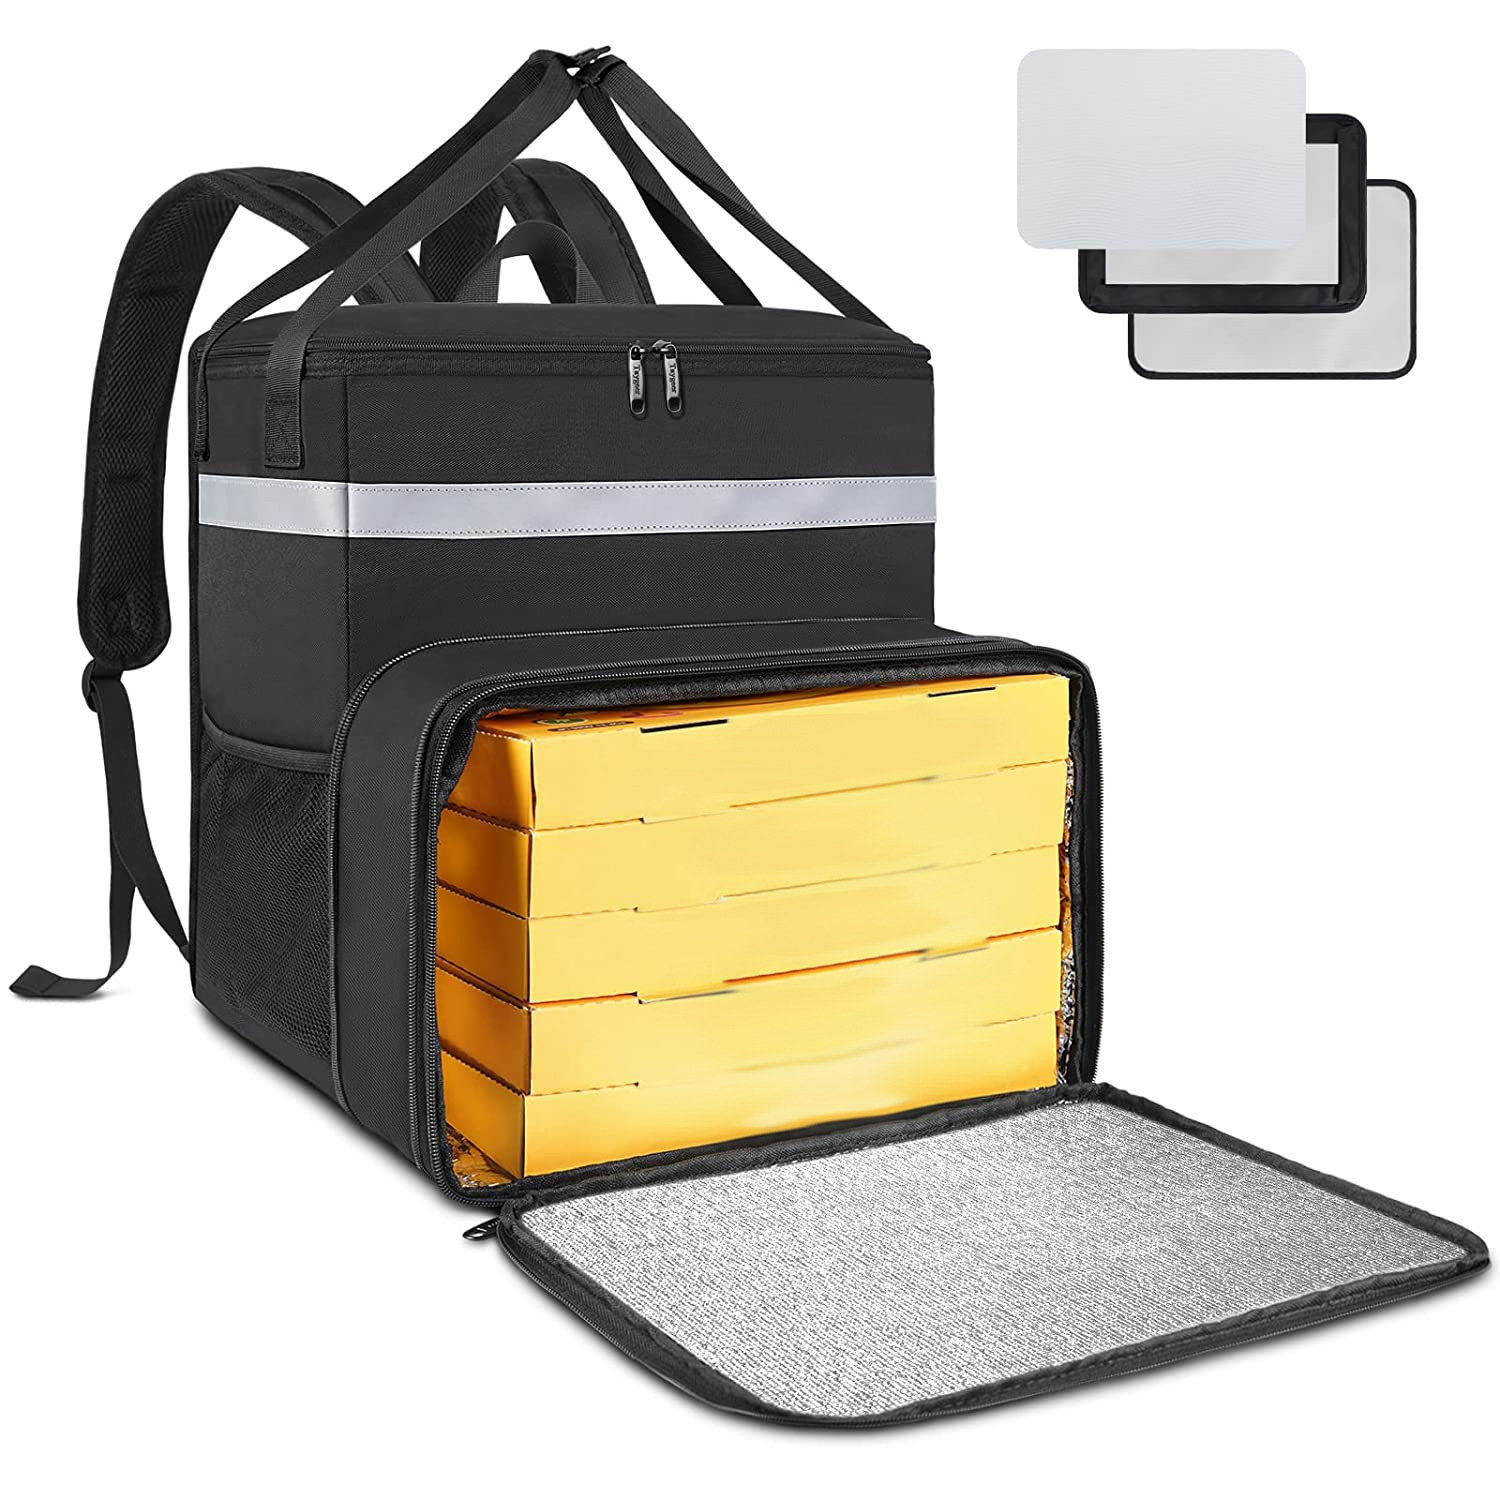
Cold chain seafood monitoring devices: Which types should you use?
You usually need a small “device ladder,” not one perfect gadget. Most operations succeed with: proof for accountability, alerts for the highest-risk lanes, and context when disputes are common.
Here are the device families you should know.
| Device type | Best use | Biggest mistake | Practical meaning for you |
|---|---|---|---|
| Temperature data logger | Evidence after delivery | No SOP to review data | Data without action |
| Real-time monitor with alerts | Preventing loss now | Too many alerts | Alert fatigue |
| GPS temperature tracker | Finding “where” | Not matching to loads | Confusing context |
| Fixed sensors (rooms/trucks) | Facility stability | Poor placement | Blind spots |
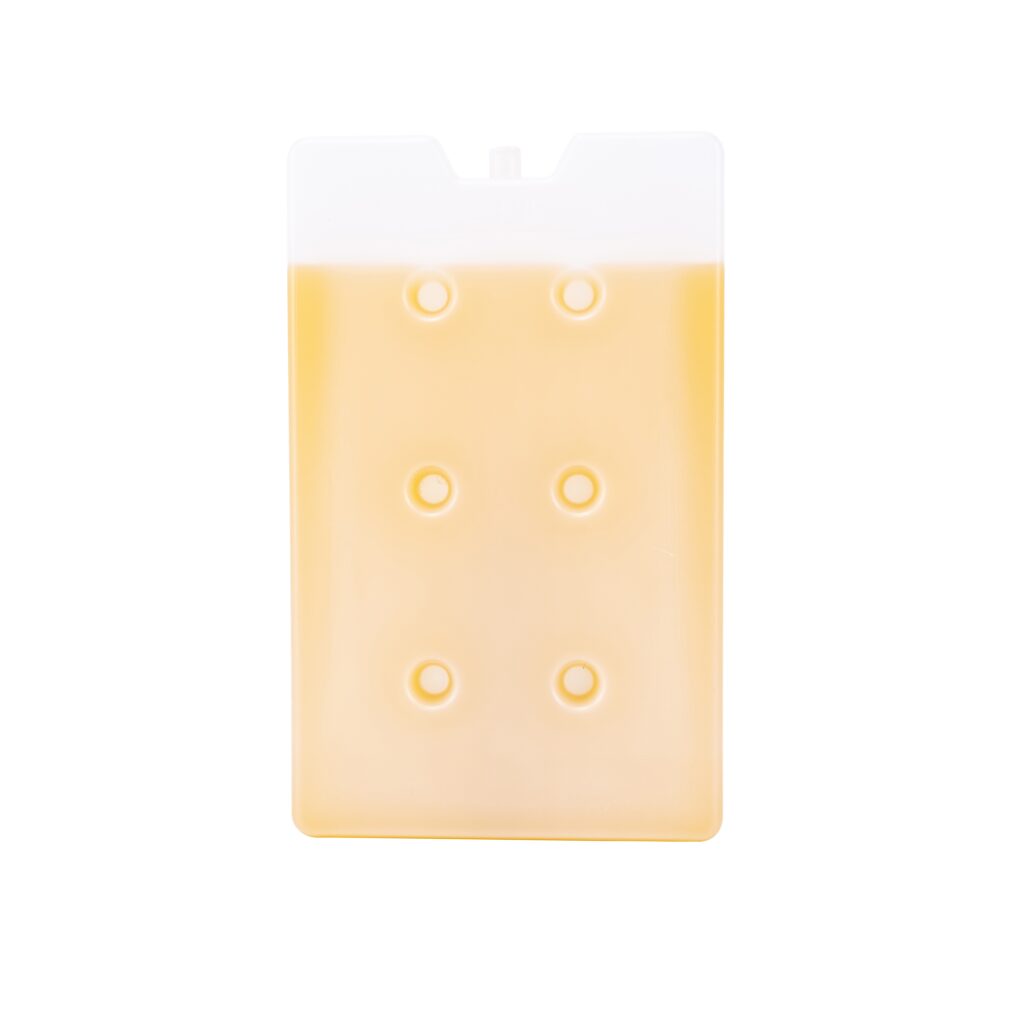
| TTIs (time–temperature indicators) | Simple handling accountability | Treating TTI as a “live alert” | Great for “was it abused?” not “save it now” |
The “Action vs Evidence” rule (60-second test)
Before you buy anything, answer one question:
- Can you act during transit?
- Yes → prioritize real-time alerts.
- No → prioritize proof loggers + a weekly review.
Practical tips and suggestions
- Start simple: prove where the problem is before buying everything.
- Match device to risk: high-value seafood deserves real-time alerts.
- Control placement: placement often matters more than sensor brand.
Practical case: A distributor saved money by using proof loggers on low-risk lanes and real-time devices only on long, delay-prone lanes.
Cold chain seafood monitoring devices: How do you choose by workflow and risk tier?
Choosing cold chain seafood monitoring devices is about your workflow, not a catalog. The best device is the one your team uses consistently and the one that matches your decision speed.
Risk tiers (simple and usable)
Segment lanes and products so monitoring cost stays under control.
| Risk tier | Typical lane reality | Recommended setup | What it means for you |
|---|---|---|---|
| Tier A (high risk / high value) | Long routes, frequent handoffs | Real-time + GPS + proof | Fewer losses on worst lanes |
| Tier B (medium) | Steady routes, controlled hubs | Proof + selective real-time | Balanced cost and control |
| Tier C (lower) | Short local lanes | Proof only (spot audits) | Baseline accountability |
Lane Risk Score (interactive decision tool)
Score each item and add points:
- Transit time: same day (0) / next day (2) / 2+ days (4)
- Heat exposure: mild (0) / mixed (2) / hot handoffs (4)
- Delay uncertainty: low (0) / medium (2) / high (4)
- Product sensitivity: frozen (1) / chilled fresh (3) / histamine-risk (4)
Score → your device stack
- 0–5: basic logger sampling + receiving checks
- 6–10: logger per shipment + weekly review
- 11–16: real-time alerts for priority loads + GPS context for disputes
Practical tips and suggestions
- Scaling fast: choose one platform and standardize training.
- Many carriers: pick devices with easy report sharing.
- Many SKUs: keep Tier A coverage tight and deliberate.
Practical case: A lane improved quickly after the team stopped trying to monitor everything live and focused real-time only where intervention was possible.
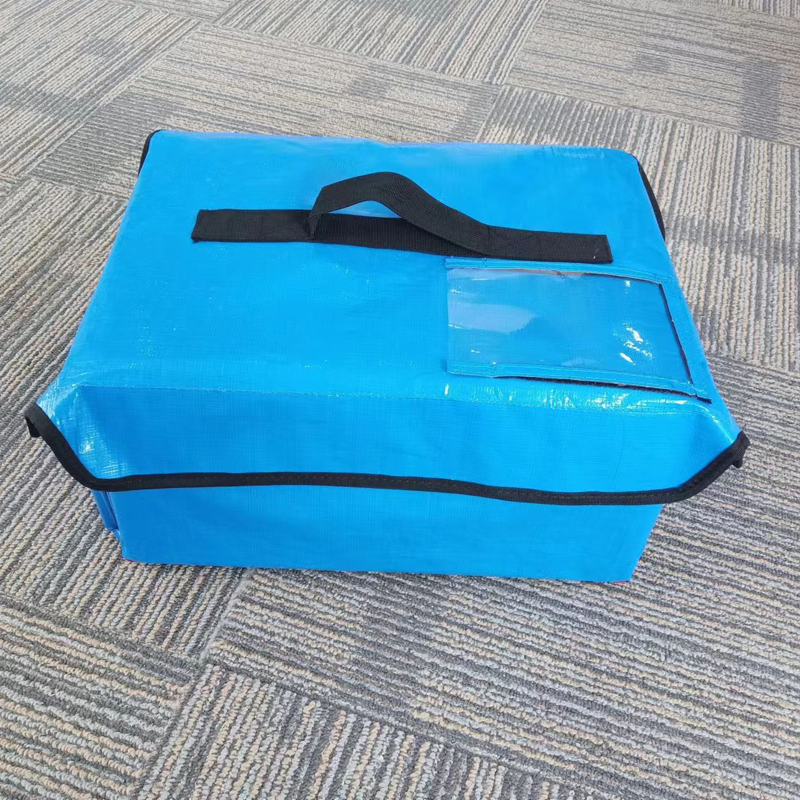
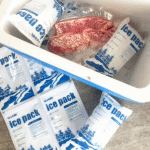
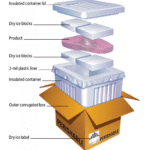
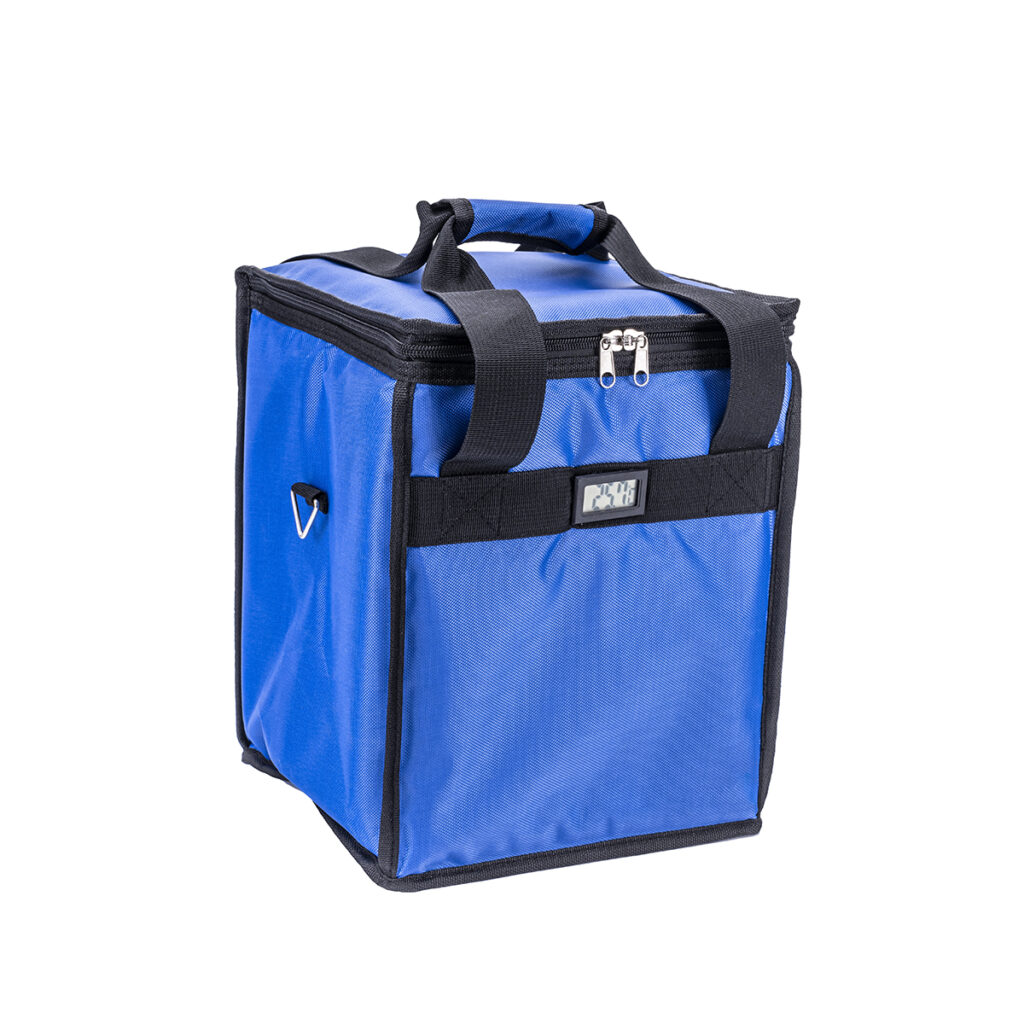
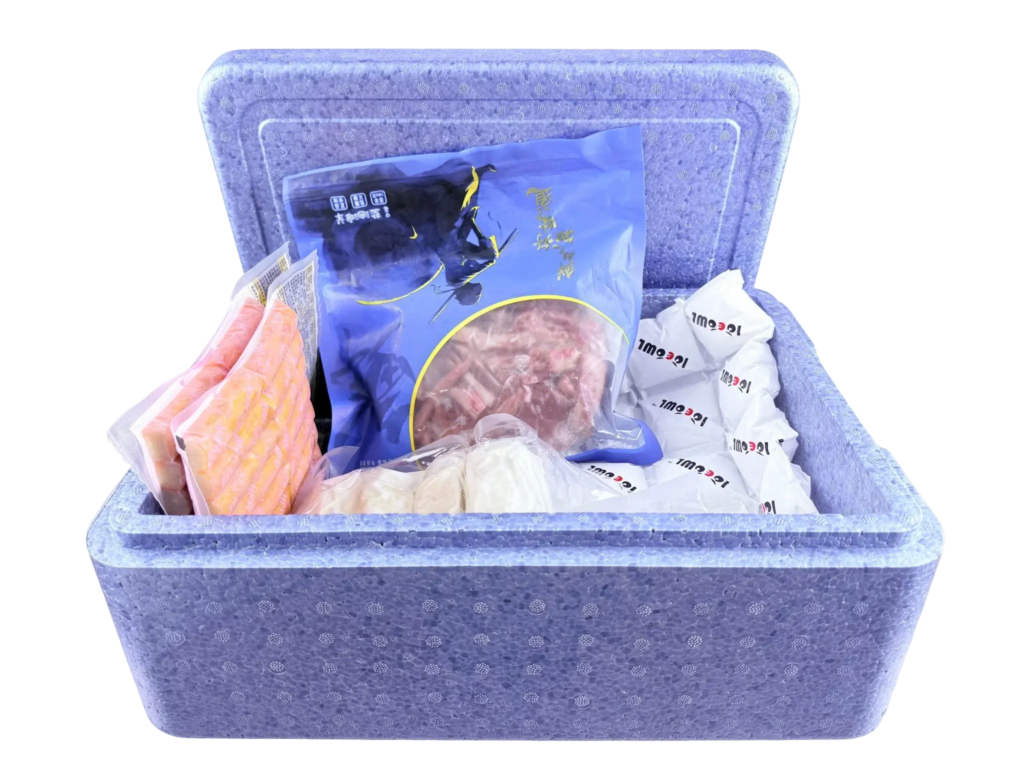
Cold chain seafood monitoring devices: Where should you place sensors?
Placement decides whether your data reflects reality. Many failures happen because sensors measure “the wrong air,” not the risk zone. Seafood warms first near warm entry points, frequent opens, and poor airflow zones.
Best-practice placement zones (simple rules)
- Measure near the warm entry point: often near the door side or top layer.
- Measure suspected hot spots: corners, edges, and frequent-open zones.
- Be consistent: same placement per lane so comparisons are fair.
| Placement choice | What it tends to read | Risk | Practical meaning for you |
|---|---|---|---|
| Near door/top layer | Warmer, more realistic | Low (if consistent) | Better risk detection |
| In direct airflow | Too cold | Miss excursions | False confidence |
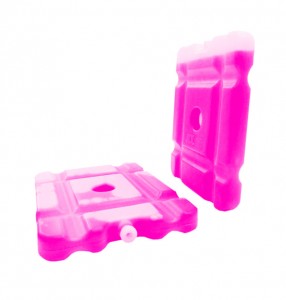
| Touching coolant | Too cold | Hides warming | Missed shelf-life loss |
Placement self-check (interactive)
Answer “Yes/No”:
- Is the sensor touching ice/gel/PCM directly?
- Is the sensor right next to a vent or fan?
- Does placement change every shipment?
If you answered Yes to any, your data may be misleading. Fix placement before buying more devices.
Practical tips and suggestions
- Use a placement photo SOP: one photo per lane is enough.
- For totes: place the device in the same tote position every time.
- For boxed shipments: avoid direct coolant contact; measure the product-zone air.
Practical case: One shipper “fixed” a lane by moving sensors away from the coldest airflow zone, revealing real excursions they had been missing.
Cold chain seafood monitoring devices: How do you set alarms that create action?
Alarms reduce loss only when they trigger a clear decision. Without a response plan, alerts become noise. Your team needs short “if this, then that” rules that work under pressure.
The 3 alert levels that prevent alert fatigue
- Warning: watch, confirm conditions
- Critical: intervene now
- Hold / Stop-the-line: high-risk event, QA decision required
The 5-step alert response (seafood-friendly)
- Confirm (door open, unit off, sensor shifted?)
- Protect (close doors, cover product)
- Stabilize (move to colder zone or backup unit)
- Record (time, temp, cause, action)
- Escalate (who decides hold/rework/reject)
| Alert scenario | First action | Second action | Benefit to you |
|---|---|---|---|
| Door-open spike | Close + protect | Coach behavior | Fewer repeat spikes |
| Unit drift | Move to backup | Maintenance ticket | Prevent larger loss |
| Delay event | Add protection | Record + escalate | Fewer disputes |
Practical tips and suggestions
- Keep messages short: “Protect + Record + Call” beats long instructions.
- Review weekly: reduce false alerts and tune thresholds.
- Avoid “instant spike” alarms that do not require action.
Practical case: Adoption improved after drivers treated alerts like a fire drill: the same 5 steps every time.
Cold chain seafood monitoring devices: What data should you track (and ignore)?
More data is not always better. Your goal is to answer: “Was the chain stable, and where did it break?” Track the few numbers that predict quality outcomes, then coach behavior and fix handoffs.
The “Seafood 6” metrics (simple and powerful)
- Average temperature (lane trend)
- Max temperature (risk moment)
- Time above threshold (damage indicator)
- Number of excursions (process stability)
- Door-open spikes (behavior indicator)
- Excursion location (ownership indicator)
| Metric | Why it matters | How to use it | Practical meaning for you |
|---|---|---|---|
| Time above threshold | Predicts damage | Compare lanes weekly | Focus improvement fast |
| Excursion count | Predicts instability | Coach processes | Fewer repeats |
| Excursion location | Finds root cause | Fix handoffs | Faster results |
What to ignore at first
- Detailed graphs nobody reviews
- Complex KPIs teams cannot explain
- Alerts that do not require action
Cold chain seafood monitoring devices: How do you stay audit-ready?
Audit-ready is simple when you build a “proof pack” per lane and keep it consistent. Devices support compliance only when records link to decisions.
What “audit-ready” looks like (simple checklist)
- A defined monitoring plan (what, where, how often)
- A basic verification routine (so readings are trusted)
- Records stored in one searchable place
- Corrective actions documented after excursions
- Training records for people who respond to alerts
The “Proof Pack” (one folder per lane)
- Temperature summary report (min/max + time above limit)
- Any excursion note + action taken
- Shipment ID + date/time + device ID
- Placement photo standard
| Audit need | Evidence from devices | Common miss | Practical meaning |
|---|---|---|---|
| Monitoring plan | Lane SOP | No lane ownership | Confusion in audits |
| Corrective action | Exception log | No action recorded | “So what?” problem |
| Training | Short training record | Not refreshed | Repeat mistakes |
Practical tips and suggestions
- If you feel overwhelmed, start with one lane and one template.
- Keep records short and readable. Long forms reduce compliance.
- Train receiving first. Receiving is where bad product enters.
Cold chain seafood monitoring devices: Traceability and event-based records in 2025
In 2025, buyers and partners increasingly want event-based traceability, not just final delivery temperature. Your monitoring becomes more valuable when it attaches to simple “events” like receiving, handoff, dispatch, and delivery.
A simple exception-first workflow
- Collect: device captures curve + timestamps
- Detect: system flags peak or time above limit
- Decide: accept, hold, test, or reject
- Correct: fix the process step that caused it
- Document: store proof for audits and claims
Example “temperature event” record (copy/paste template)
{
  "eventTime": "2025-12-19T19:42:00Z",
  "eventType": "TemperatureExcursion",
  "lane": "SEA-CHI-NextDay",
  "shipmentId": "LOT-20251219-1047",
  "deviceId": "LOGGER-009183",
  "peakTempC": 9.2,
  "minutesAboveLimit": 67,
  "limitC": 4.4,
  "locationHint": "LastMile",
  "actionTaken": "HoldAndInspect"
}
Cold chain seafood monitoring devices: How do you validate lanes and packaging?
Validation is how you stop arguing and start standardizing. If you change packaging, routes, or carriers, validate again.
The 3-lane validation plan (fast and effective)
- Worst hot lane (summer conditions)
- Worst cold lane (winter exposure)
- Your volume lane (most shipments)
| Item | Pass rule | Evidence | Action if fail |
|---|---|---|---|
| Temperature stability | Meets lane target most of trip | Logger curve | Adjust pack-out or lane rules |
| Time out of range | Below your max duration | Time-in-excursion | Tune alarms + SOP |
| Handoff discipline | Minimal door-open time | Timestamps + notes | Re-train and re-stage |
| Packaging integrity | No leaks/soak | Receiving photos | Add liners/drainage rules |
Practical tips and suggestions
- Validate one variable at a time so you can learn.
- Use devices to teach, not only to audit. Share results with operators.
- Pre-write corrective actions. “Decide later” becomes “shipped anyway.”
Cold chain seafood monitoring devices: 30-day rollout plan that teams will follow
Rollouts fail when devices feel like extra work. Make the program feel like protection that reduces future headaches. Start small, prove value, then expand.
A simple 30-day rollout
| Week | Focus | What success looks like | Meaning for you |
|---|---|---|---|
| 1 | One pilot lane + placement SOP | Clean, consistent data | Confidence |
| 2 | Fix top 2 causes | Fewer spikes | Real improvement |
| 3 | Expand to lane #2 | Comparable lanes | Scaling control |
| 4 | Lock standards | Repeatable system | Lower operating risk |
Practical tips and suggestions
- Make SOPs visual: one page, one photo, five response steps.
- Keep training short: 10 minutes beats 60 minutes.
- Celebrate one quick win. One fixed staging habit can justify the program.
Practical case: Adoption improved after switching from long guides to daily 6-minute drills on placement and response steps.
2025 latest developments and trends
In 2025, the strongest programs treat cold chain seafood monitoring devices as a system: device + SOP + training + weekly review. Devices alone rarely solve quality issues.
Latest progress snapshot (practical)
- Selective real-time adoption: real-time on Tier A lanes, loggers elsewhere.
- Alert fatigue reduction: fewer alert levels, more action-based triggers.
- More focus on handoffs: monitoring shifts to docks and transfer points.
- Growing interest in TTIs and quality sensing: useful after the basics are stable.
Frequently asked questions
Q1: Do cold chain seafood monitoring devices need to be real-time?
Not always. If you cannot intervene during transit, proof loggers plus strong receiving checks are often enough. Use real-time alerts only on lanes where someone can actually act.
Q2: What is the biggest mistake with cold chain seafood monitoring devices?
Inconsistent placement and missing SOPs. If placement changes each run, you cannot compare curves. If nobody reviews data weekly, you just bought expensive paperwork.
Q3: How many alert levels should we set?
Start with two or three levels only. Too many alerts cause fatigue and slower responses. Then tune thresholds after two weeks of real lane data.
Q4: Where is the best placement for temperature loggers in seafood boxes?
Place the sensor near the warmest expected zone, often near the top layer or door-side risk area. Avoid direct airflow and direct coolant contact to prevent misleading readings.
Q5: Can a GPS temperature tracker reduce disputes?
Yes. GPS adds location context so you can identify where excursions happen. That reduces “blame loops” and helps you fix the handoff point causing repeat loss.
Q6: What should we review every week?
Review peak temperature, time above threshold, and where excursions occur. Fix the top one or two causes per week, then re-test to confirm improvement.
Summary and recommendations
Cold chain seafood monitoring devices protect freshness by revealing where instability happens: docks, handoffs, doors, and delays. Start with the “Seafood 6” metrics, standardize placement with photos, and keep alerts action-based. Use proof loggers for baseline lane truth, add real-time only where intervention is possible, and add GPS when disputes are common. Then run a 30-day pilot, fix two root causes, and lock a repeatable lane standard.
Next-step action plan (CTA):
- Pilot one high-risk lane for 30 days with standardized placement.
- Use only 2–3 alert levels and a 5-step response plan.
- Track time above threshold and excursion location, then fix the top 2 causes.
- Expand only after SOPs are stable and responses are consistent.
About Tempk
At Tempk, we help seafood cold chain operators turn monitoring into practical control. We combine packaging options with monitoring routines, simple alert response workflows, and repeatable reporting so you reduce excursions and improve accountability across handoffs.
Call to action: If you want a lane-by-lane blueprint for cold chain seafood monitoring devices—device selection by risk tier, placement SOPs, alert thresholds, and a 30-day rollout plan—contact Tempk for a practical program design you can implement immediately.