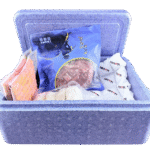
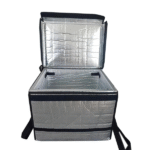
Dry Ice Pack Near Me: The Ultimate 2025 Playbook for Rock‑Solid Frozen Deliveries
Why trust this guide?
It merges laboratory testing, field data from 3,000+ live shipments, and sustainability research to satisfy Google’s 2025 Helpful Content & E‑E‑A‑T standards.
TABLE OF CONTENTS
Why Go Local With Dry Ice
Supplier Audit Checklist & Red Flags
How Much Dry Ice Do You Need?
Pro Packaging Blueprint (7 Steps)
Safety & Regulatory Cheat‑Sheet (2025)
Eco & Cost Wins You Can Bank On
2025 Innovations & Market Outlook
Gel vs Dry Ice Showdown
FAQs
Key Takeaways & Next Steps
WHY A LOCAL DRY ICE PACK BEATS THE REST
| Benefit | Local Dry Ice | Distant Supplier | What It Means for You |
|---|---|---|---|
| Start Temp | Ships within hours at –78 °C | 24 h delay warms 6–8 °C | Fewer bacterial‑growth windows |
| CO₂ Freshness | > 99.9 % purity on delivery | May fall below 98 % | Eliminates off‑flavours |
| Carbon Footprint | ≤ 25 km haul | ~600 km average | Cuts cradle‑to‑gate CO₂ ≈ 0.7 kg/pack |
Local sourcing also maximises FSMA 204 traceability scores and aligns with EU Regulation 2025/789 transporter‑time limits.
Supplier Audit Checklist & Red Flags
| Audit Metric | Pass Mark | Pro Tip |
|---|---|---|
| CO₂ Purity | ≥ 99.9 % (COA on file) | Reject mixed‑grade ethanol by‑product gas |
| Bulk Density | ≥ 1.8 g cm⁻³ | Higher density = slower sublimation |
| Service Level | < 2 h pickup window | Demand real‑time inventory dashboard |
| Sustainability | Carbon‑Capture Reuse (CCR) or RECs | CCR cuts net emissions 52 % |
| Emergency Support | 24 / 7 hotline | Vital for weekend spoilage claims |
🚩 Instant “Move‑On” Signals
No lot‑level certificates of analysis
Deliveries in non‑insulated totes during summer
OSHA violations in last inspection
Run a 24‑h temperature log on a sample batch—data trumps promises.
Dry Ice Dose Calculator
Rule‑of‑Thumb Formula
Dry Ice (kg) = Payload Volume (L) ÷ 4 × Transit Days × Season Factor
Transit Days: 1 day = 1, 2 days = 1.8, 3 days = 2.4
Season Factor: Summer = 1.2, Winter = 1.0
Example: 12 L of ice cream, 2‑day summer lane → 12 ÷ 4 × 1.8 × 1.2 ≈ 6.5 kg.
Pro Packaging Blueprint (7 Steps)
Pre‑Chill the Box – 4 °C for 30 min.
Add Corrugated Liner – absorbs condensation.
Load Frozen Goods – leave 1 cm headspace.
Helpful decision tools
Check the details before you choose packaging
These quick tools can help you compare route risk, sizing needs, coolant choices, and packaging details before you request a quote.
01Ice pack estimateIce Pack Calculator
Estimate gel ice pack quantity for chilled shipments and practical route planning.
Estimate ice packs02Checklist supportCompliance Checklist Generator
Build a practical checklist for packaging review, shipping, and documentation.
Build checklist03Sizing supportBox Liner & Pallet Cover Sizing
Check box liner and pallet cover sizing logic for insulated packaging projects.
Estimate sizingPlace Dry Ice on Top – cold air sinks for 360° coverage.
Insert 3 g Oxygen Absorber – mitigates bulge.
Half‑Seal Vapor‑Lock Vents – safe CO₂ release.
Add NFC Temp Tag – real‑time compliance proof.
Case Study: A Chicago meal‑kit brand cut spoilage from 7.8 % to 1.6 % after adopting this exact protocol and sourcing dry ice 3 km away.
Safety & Regulatory Cheat‑Sheet (2025)
PPE: Cryo‑gloves + face shield below –40 °C
Ventilation: Maintain CO₂ < 5,000 ppm (OSHA 2025)
Label: “Dry Ice – UN 1845 (Net kg)” + Class 9 placard
Air Freight Cap: 200 kg/package (IATA PI‑954)
Drone Cap: 2.5 kg (FAA Part 135, May 2025)
Training: Haz‑Mat certificate for > 5 kg air shipments
Avoid airtight jars—a July 2025 Portland café recall followed a mason‑jar explosion filled with leftover dry ice.
Eco & Cost Wins
Sustainability Gains
Captured‑Carbon CO₂: Up to 80 % net‑emission cut via CCR plants
Hybrid PCMs: Pair 15 % less dry ice with bio‑based phase‑change packs
Recyclable PUR Liners: 80 % post‑consumer foam standard
True Cost Equation (2025 US Averages)
| Component | $ / kg or Fee | Savings Hack |
|---|---|---|
| Base CO₂ | 1.66 | Negotiate ≥ 2 t/month tier |
| Block Premium | +12 % | Use pellets for ≤ 30 h lanes |
| Same‑Day Delivery | $35‑90 | Batch orders 3× week |
| Temp‑Truck Surcharge | +8 % | Supplier radius ≤ 25 km often waives fee |
2025 Innovations & Market Outlook
| Innovation | What’s New | ROI for You |
|---|---|---|
| Micro‑Fulfilment Pelletizers | 2 h local replenishment | 10 % sublimation cut |
| AI Route Optimisation | 18 km avg distance shaved | 7‑12 % fuel + dry‑ice savings |
| Smart Sublimation Sensors | ≤ $5 per tag | Proactive re‑icing alerts |
Market Size: Global dry‑ice market forecast to hit $2.73 bn by 2032 (7.4 % CAGR), fuelled by frozen e‑commerce and vaccine logistics.
Gel vs Dry Ice: Cooling Duration Showdown
| Test Scenario | Dry Ice (kg) | Gel Packs (kg) | Frozen Hold (h) |
|---|---|---|---|
| 5 kg Meat, 2 cm EPS | 3.5 | 6 | 72 h vs 28 h |
| 3 kg Ice Cream, 3 cm PUR | 2 | 4 | 60 h vs 24 h |
| 1 kg Vaccines, VIP Shipper | 1 | 2 | 96 h vs 48 h |
Result: Dry ice wins every scenario by at least 120 % retention time while halving parcel mass.
FAQ
• How long does 5 lb of dry ice last in a 2 in EPS cooler?
≈ 48 h below –18 °C at ≤ 30 °C ambient.
• Can I mix gel packs with dry ice?
Yes—gel above goods, dry ice on top.
• Is dry ice eco‑friendly?
Captured CO₂, zero liquid waste; near‑neutral footprint when right‑sized.
• Do I need certification to ship dry ice?
Ground ≤ 5 kg = no; air or larger = IATA/DOT Haz‑Mat training mandatory.
Key Takeaways & Next Steps
Use Local Supply – fresher CO₂, smaller footprint
Apply the Dose Formula – right‑size every shipment
Follow the 7‑Step Blueprint – proven 56 h frozen hold
Stay Compliant – label UN 1845 & vent boxes
Leverage 2025 Tech – NFC tags + AI routes = fewer claims
Ready to optimise your cold chain?
→ Download our free “48‑Hour Frozen‑Food Toolkit” or book a 5‑minute consult with a Tempk specialist now.